.png)
Reporting from multiple engineering systems is crucial for maintaining the high velocity and quality standards required in today’s tech industry. However, creating reports can be challenging due to the need for deep technical expertise and aggregation of many separate systems worth of data. While some IDPs offer a high level of reporting customization, many tend to require a steep learning curve and significant manual setup, which can be a hurdle for teams looking to implement IDP reporting quickly and efficiently.
IDPs should deliver actionable, comprehensive reporting that scales from the organization level down to domains, teams, and individual software components. Ask questions, filter output, and find the answers that matter.
Reports generated within an IDP help you make sense of your software—and quantify quality. Instead of relying on manually piecing together disparate teams’ institutional knowledge, reports in your IDP make it effortless to answer questions, see team performance, and view trends. Gone are the days of wondering who owns a service, how “healthy” or mature it is, and what needs to be done to bring it into alignment with established standards.
Cortex simplifies this by offering built-in reporting capabilities that deliver insights tailored to various organizational levels—from individual contributors to executives—without the need for specialized skills. Cortex equips teams with the power to proactively manage their software ecosystem, driving continuous improvement and innovation at every level.
Automate multi-view reports
Cortex makes it easy to quickly generate reports by integrating with your existing data sources and providing a comprehensive set of reports out of the box. These reports help you answer questions about the state of your organization in an easy-to-understand format.
Many Cortex reports are built on Scorecards, a feature that enables you to quantify the quality of your software components and resources. Scorecards work with your existing data sources and rules that you create to give a holistic view of the team’s alignment with broader organizational objectives and initiatives. Below is an example of a service maturity scorecard:

Reports aggregate the component-level information that scorecards provide, and let you answer questions about the overall state of your software. Reports can answer questions like:
- How secure are our services?
- Are we adhering to industry best practices?
- Which services require immediate attention?
- And crucially, where should the next wave of engineering resources be directed to make a tangible impact?
These insights are not just about keeping a tab on the present but enable better strategic planning and resource allocation for the future. By integrating with existing data sources and leveraging them as the source of truth, Cortex ensures that reporting is integral to the development lifecycle, not an afterthought. Cortex Reports empower teams not just to perform their roles, but to push the boundaries of innovation and efficiency within their organizations.
Built-in Cortex Reports
Cortex integrations coupled with Cortex Reports means teams can get actionable insights in moments not months. Cortex Reports use data from the tools teams already use, enabling organizational insights without causing organizational disruption.
See progress across your whole organization with the Bird’s Eye Report
The Bird’s Eye Report shows you the status of scorecards across all your software. It allows you to filter views by component, team, or domain, so you can answer questions with whatever granularity is needed.

Example questions you can answer with this report:
- Which best practices does the team most often miss?
- Which best practices should we prioritize going forward? Do we need to create any Initiatives?
- Which teams score best on DORA metrics?
- How many services hit the gold standard for security maturity?
Get quick high-level insights with the Executive Report
The Executive Report gives you at-a-glance stats on your organization. It provides the sort of high-level information that would appear on an end-of-quarter engineering summary, including:
- Number of software components your organization looks after
- Number of deploys that occurred in the last week/month/quarter
- Scorecard progress by team
- Scorecard progress against time
You can quickly highlight organizational strengths and weaknesses with the Executive Report.

Example questions you can answer with this report:
- Which quality areas should we focus on next quarter?
- Is the quality of our services increasing or decreasing over time?
- Which teams might need more help to meet our quality standards?
Track organizational progress over time - Progress Report
The Progress Report shows you the trend of your scorecards over time. You can select a scorecard and see how it has trended over the past week, month, or quarter. You can also break this chart down by team, group, or rule to see drivers for any trend.

Example questions you can answer with this report:
- Is our recent initiative paying off?
- Which teams are contributing to the increase in Javascript best practices score?
- What are the drivers behind the recent DORA metrics decline?
See actionable insights in a single area with the Report Card
The Report Card gives a quick overview of your organization’s performance on a given scorecard. It shows the top performing software components, those most at risk, and the largest recent changes in score.

Example questions you can answer with this report:
- Which services should we prioritize improving security standards on?
- Do any of our Javascript best practices need more awareness?
- Which services are scoring highest on maturity?
Uncover larger trends with Eng Intelligence
At Cortex, we believe true power in engineering metrics comes in the form of intelligence - hence the recently announced and aptly named “Eng Intelligence” solution, combining metrics directly alongside context to drive action in unblocking engineering teams.
With Eng Intelligence, easily track changes to key metrics and view trends over time. Users can then dive into team and group detail pages to understand the factors behind the trend, and then act on any concerning trends by creating new scorecards or rules.
Eng Intelligence is powered by data you’re already using in Cortex, like GitHub, GitLab, PagerDuty, and Jira. Data is then presented by team, group, or individual, and can be filtered by time to help users spot trends between key metrics like PR size and velocity.

Extend Cortex Reports with Plugins
Cortex enables powerful visualization through the built-in reports, but doesn’t restrict you to what comes in the box. Cortex’s UI is extensible through the Plugins framework. The Plugins framework enables you to show extra context alongside Cortex data on the entity or homepage, as well as embed Cortex data in external tools.
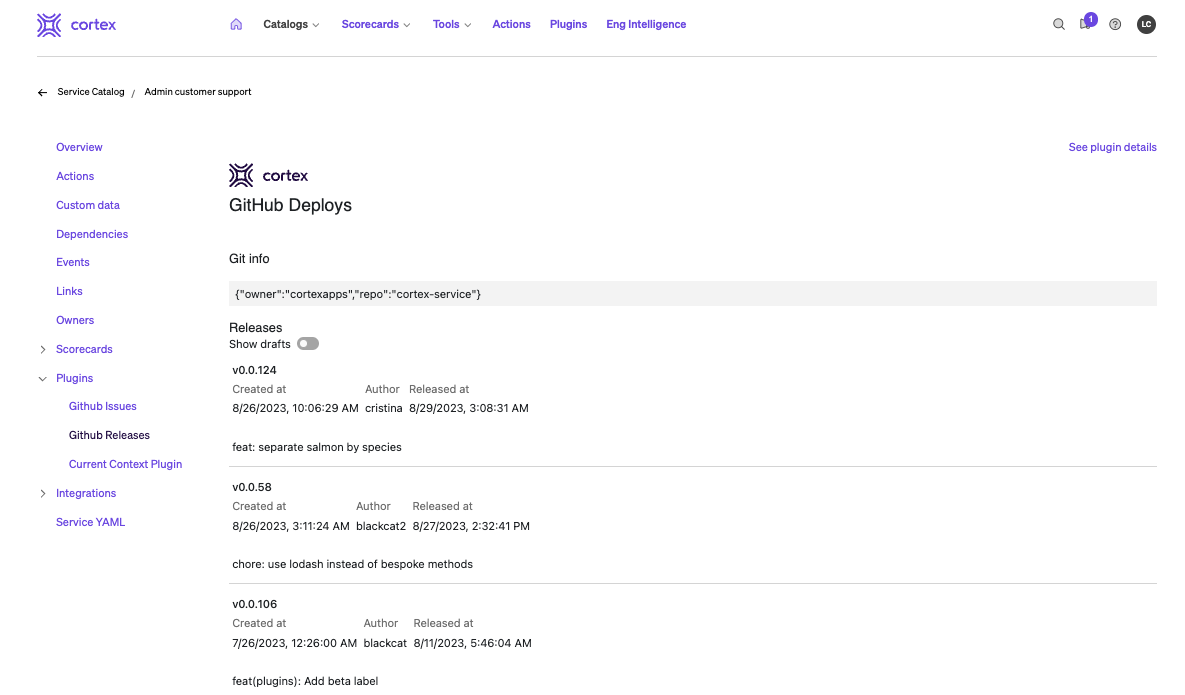
For example, if you wanted to give your developers more context on the vulnerabilities that had been detected in a security report, you could use Plugins to create a widget that shows that data in the Cortex UI. The below screenshot shows an example of a GitHub Deployment plugin that is accessible via an individual service. While Cortex has a robust integration with GitHub, users of this plugin may want to extend thier view of recent releases to aid in investigation when issues arise.
The blog post that introduced Plugins has step-by-step instructions for creating your own, and more examples of the powerful ways you can use Plugins to enhance your team’s workflow.
Extend Cortex Reports with CQL
Just looking for a quick table view for specific point in time or persistent queries? Like which software is connected to new security tooling, or which software is still running an old version of Log4j? Cortex query language (CQL) can be used to build custom reports that you can save, share, and reference as needed, without needing to export to a spreadsheet for deeper analysis.

Cortex reporting is both fast, and extensible, to grow with your organizations needs while still providing value on day one. If you’re interested in what Cortex can do for your organization, check out our self-guided tour, or book a demo with our team.
.png)

